COVOID is a R package for modelling COVID-19 and other infectious diseases using deterministic compartmental models (DCMs). It contains a built-in Shiny app enabling easy use and demonstration of key concepts to those without R programming backgrounds, along with an expanding API for simulating and estimating homogeneous and age-structured SIR, SEIR and extended models. In particular COVOID allows the simultaneous simulation of age specific (e.g. school closures) and general interventions over varying time intervals.
Please see the documentation available from the menu above for more information.
Acknowledgements and support
Work on COVOID is facilitated by the generous assistance of Ian Sharp, philanthropic supporter of UNSW research.
If you would like to support our work, please see the UNSW Alumni & Giving web site for details of how to donate, or contact us directly at timothy.churches@unsw.edu.au
Installation
You can install the development version of COVOID from GitHub with:
# install.packages("devtools")
devtools::install_github("cbdrh/covoid",build_vignettes = TRUE)
An example
This is a basic introduction to COVOID package syntax. We demonstrate how to simulate an epidemic along with the impact of disease prevention policies using an age-structured SIR model. The populations demographics are matched to that of Australia, with a population of 4 million and 10 initial cases. The functions import_contact_matrix and import_age_distribution import data from Prem et al. (2017) (Prem, Cook, and Jit 2017) and the United Nations Population Division (2019) (United Nations Population Division 2019) on age specific contact rates and distributions, both grouped by 5 years. There are ~150 countries with both contact and age demographic information available in COVOID.
library(covoid)
cm_oz <- import_contact_matrix("Australia","general")
p_age_oz <- import_age_distribution("Australia")
# initial conditions
S0 <- p_age_oz*4e6
I0 <- c(0,0,0,0,0,5,3,1,2,0,0,0,0,0,0,0)
R0 <- rep(0,length(S0))
We first consider the case without any interventions, in which the epidemic runs its course. The sir_c_param takes uses the basic reproduction number R0 and the inverse of the average disease length gamma to parameterise the system of ODEs, and infer other parameters such the probability of disease transmission.
param <- sir_c_param(R0 = 2.5,gamma = 0.1,cm=cm_oz,dist=p_age_oz)
state0 <- sir_c_state0(S0, I0, R0)
res <- simulate_sir_c(t = 300,state_t0 = state0,param = param)
plot(res,y=c("S","I","R"),main="No intervention")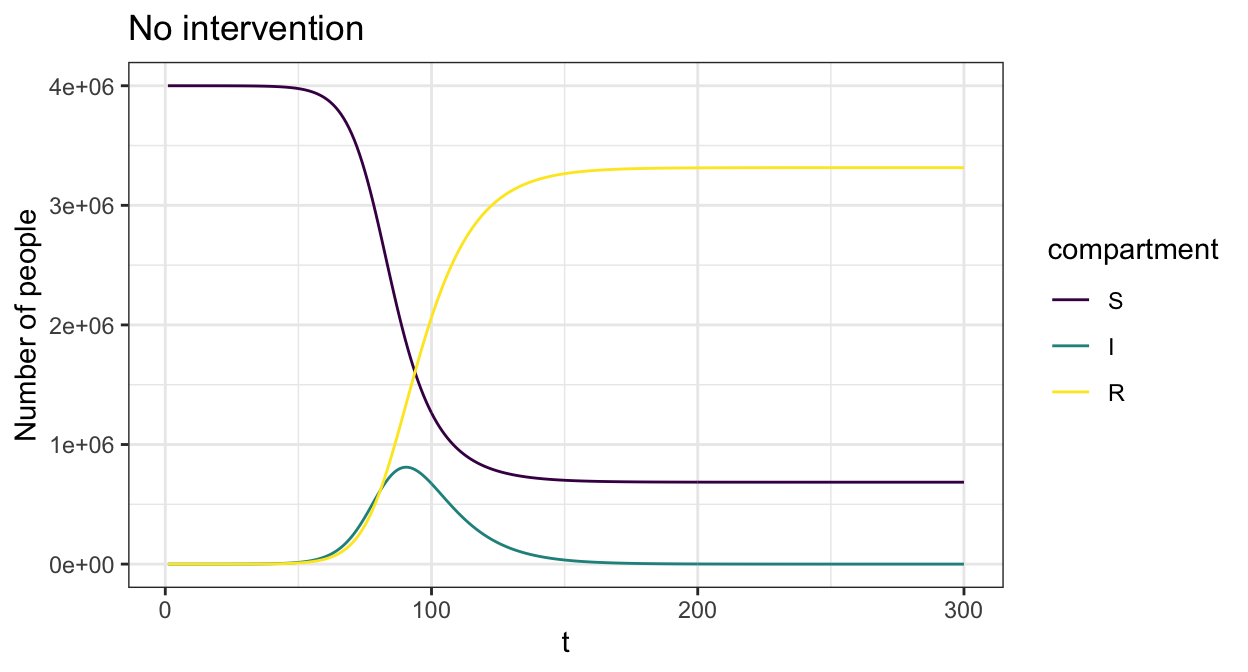
We can add in time varying interventions that reduce contact rates across the population using create_contact_intervention(). The below example reduces all physical contact by 20% in order to simulate physical distancing.
phys_dist = contact_intervention(start = 10,stop = 150,reduce = 0.8,start_delay = 5,stop_delay = 5)
param <- sir_c_param(R0 = 2.5,gamma = 0.1,cm=cm_oz,dist=p_age_oz,contact_intervention = phys_dist)
state0 <- sir_c_state0(S0, I0, R0)
res <- simulate_sir_c(t = 300,state_t0 = state0,param = param)
plot(res,y=c("S","I","R"),main="Physical distancing")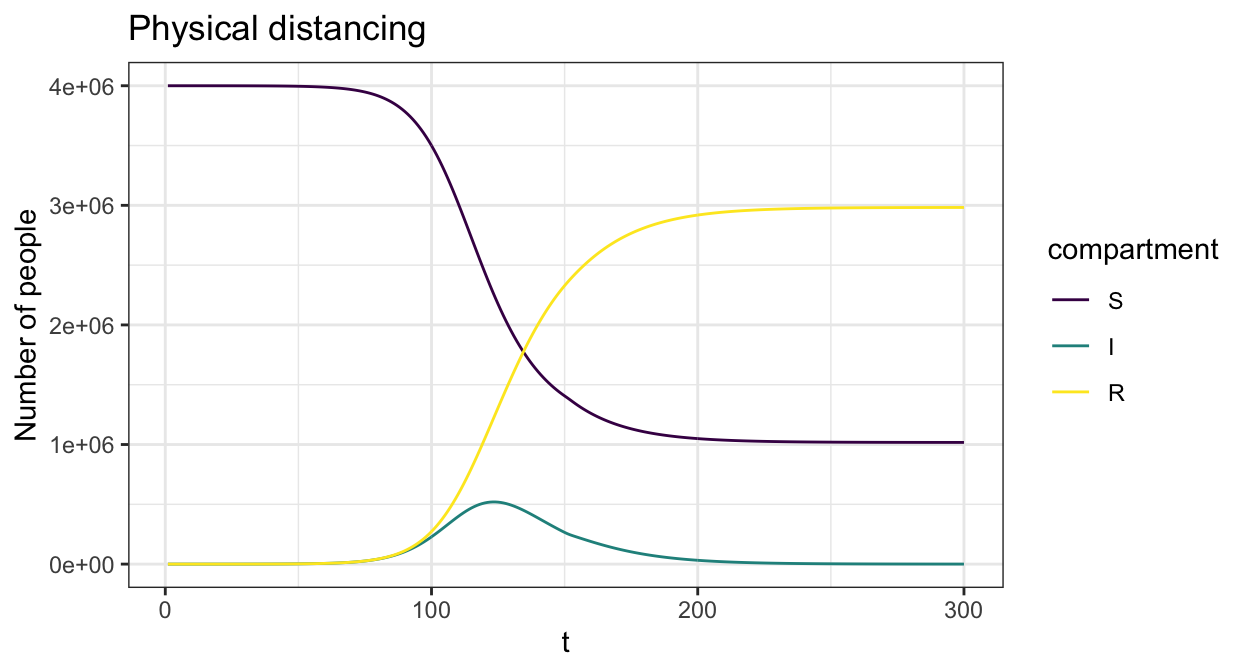
The COVOID package also allows you to separate the contact rates into different settings - e.g. school, work and home.
cm_oz_all <- import_contact_matrix("Australia","general")
cm_oz_sch <- import_contact_matrix("Australia","school")
# separate out school and general population contact rates
cm_oz_all = cm_oz_all - cm_oz_sch
p_all <- plot(cm_oz_all) +
    labs(title = "General") +
    theme(axis.text.x = element_text(size=6, angle=0),
          axis.text.y = element_text(size=6))
p_sch <- plot(cm_oz_sch) +
    labs(title = "School") +
    theme(axis.text.x = element_text(size=6, angle=0),
          axis.text.y = element_text(size=6))

p_all + p_sch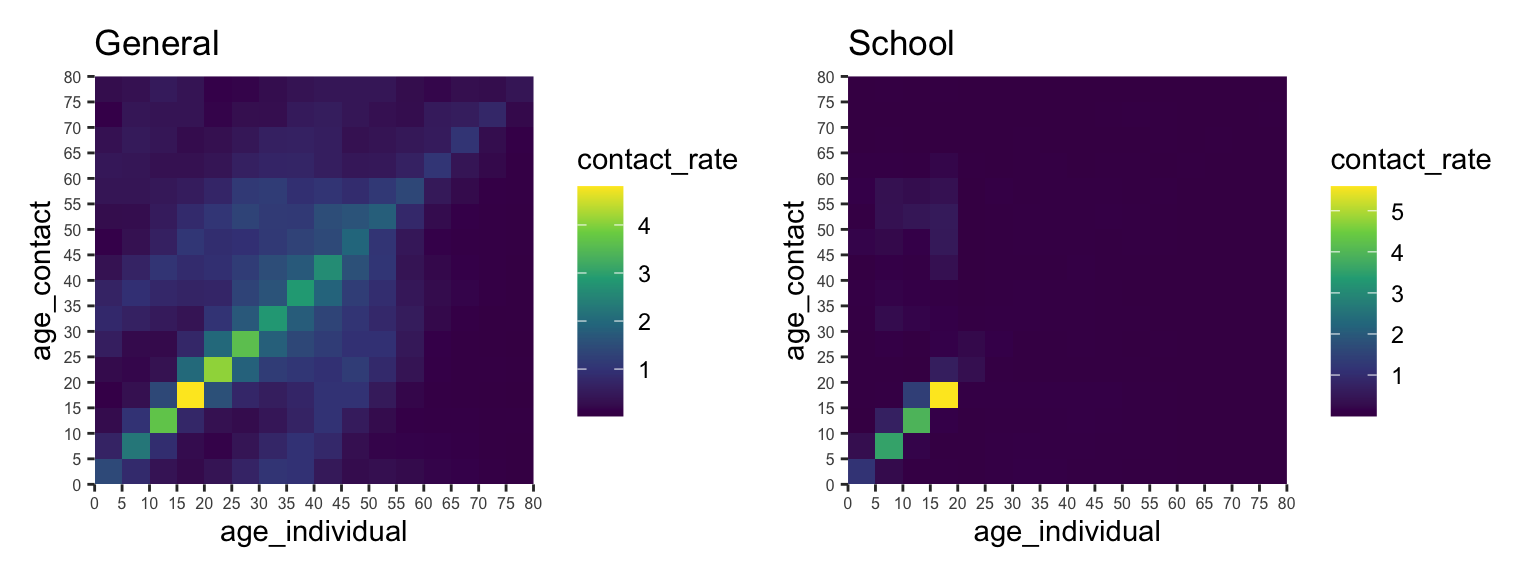
We can then add in time varying interventions using create_intervention to each setting. The below example reduces general contact by 20% to simulate physical distancing combined with a reduction in school age contact by 80% to simulate school closures.
cm = list(all = cm_oz_all, sch = cm_oz_sch)
int = list(sch=contact_intervention(start = 10,stop = 150,reduce = 0.2,start_delay = 5,stop_delay = 5),
           all=contact_intervention(start = 10,stop = 150,reduce = 0.8,start_delay = 5,stop_delay = 5))
param <- sir_c_param(R0 = 2.5,gamma = 0.1,cm=cm,dist=p_age_oz,contact_intervention = int)
state0 <- sir_c_state0(S0, I0, R0)
res <- simulate_sir_c(t = 300,state_t0 = state0,param = param)
plot(res,y=c("S","I","R"),main="Physical distancing + school closures")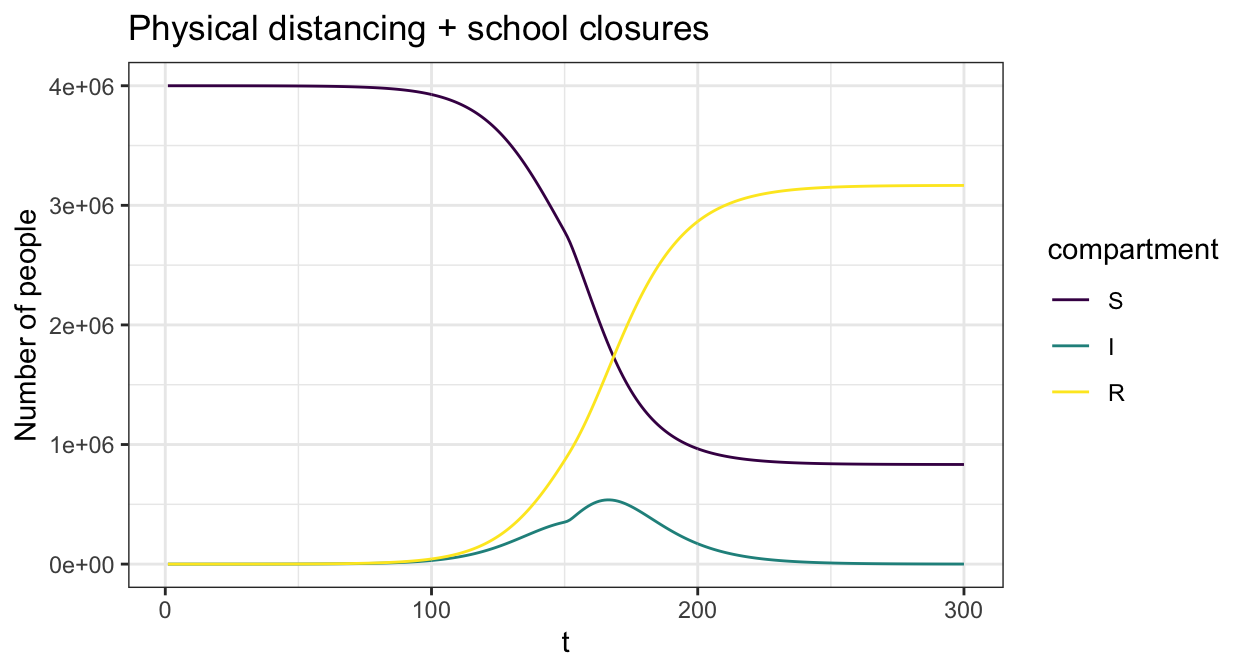
Prem, Kiesha, Alex R Cook, and Mark Jit. 2017. “Projecting Social Contact Matrices in 152 Countries Using Contact Surveys and Demographic Data.” PLoS Computational Biology 13 (9): e1005697.
United Nations Population Division. 2019. “World Population Prospects 2019, Online Edition.” United Nations, Department of Economic; Social Affairs.